


Factor analysis aim to provide usable numerical values for quantities such as intelligence or social status that are not directly measurable.
The data is to use correlation between observable variables in terms of underlying “factors”.
“Factors” in factor analysis is not the same as the categorical explanatory variables.
Compared with PCA, the variables themselves are of relatively little interest in factor analysis; it is an understanding of the hypothesized underlying factor factor that is the main aim.
The idea is that the correlation amongst the variables are explained by the common factor.
The function “factanal” performs maximum likelihood factor analysis on a covariance matrix or data matrix.
The “pgd” dataframe, you need to specify the number of factors you want to estimate.
Ok, I don’t have any data, so we will use this data which is provided by stanford, lets have look into the data.
mydata<-read.table("http://web.stanford.edu/class/psych253/data/personality0.txt")
head(mydata)

Ok, now we have make clusters of categories
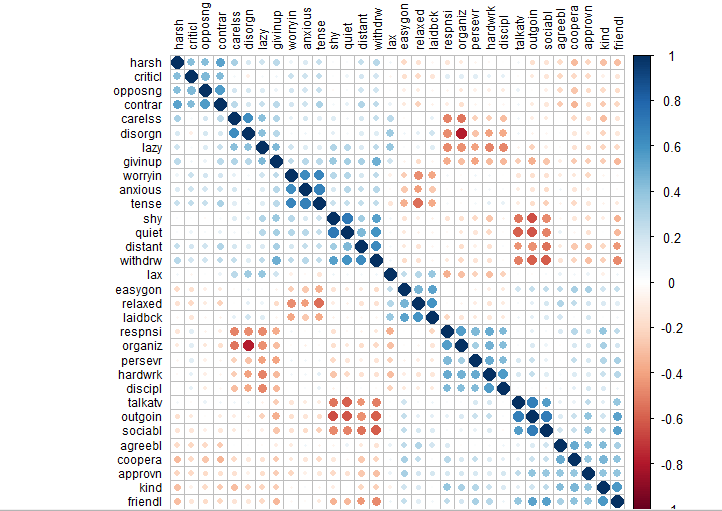
For dataframes with many columns, corrplot can be useful to get a sense of the structure in the given data. To plot the correaltion graph, you will need corrplot package, in case you don’t know how to install packages then learn below
install.packages("corrplot") #it will install the package.
library(corrplot) #to use this package you need to provide the library like this
corrplot(cor(mydata), order="hclust",tl.col="black",tl.cex=.75)
Here is the R console output

There appears to be some structure in the data, with 2 general classes of traits (negative vs. positive), and within each cluster, there are some sub-clusters that hang together.
factanal(mydata,8)
Here is the R console output of factanal()


We can look at the sums of squared (SS) loadings.
Sum of squared loadings are the eigenvalues, or the variance in all variables which is accounted for by that factor (i.e., the eigenvalue/# of variables = proportion variance).
If a factor has a “high” sum of squared loadings/eigenvalue, then it is helping to explain the variances. in the variables.
In the factanal() output, the factors are ordered by their eigenvalues, with higher eigenvalues first. As a rule-of-thumb a factor is important if its eigenvalue is greater than 1 (i.e., the average); this is also referred to as the Kaiser Rule. Here, factors 1-6 appear to be important.
We can calculate the eigen values from factor loadings.
fact1_loadings = residual$loadings[,1]
fact1_eigenvalue = sum(fact1_loadings^2)
fact1_eigenvalue
Compute proportion variance
fact1_eigenvalue/32

Calculate uniqueness & communality
loadingsfactor_uniqueness = residual$loadings[1,]
communalityfactor_uniquness = sum(loadingsfactor_uniqueness^2)
communalityfactor_uniqueness
Note that the loadings are of length 32 (the number of variables) not 240 (the number of rows in the dataframe representing the different plots in the experiment), so we cannot plot the loadings against the covariates, as we can do with PCA. However, we can plot the factor loadings against one another:
Plot loadings against one another
load = residual$loadings[,1:1]
 # set up plot
plot(load, type="n")
# add variable names
text(load,labels=names(d_stan),cex=.7)
Here is the plot

Lets stay tuned for the next part of this tutorial.
Till then please give your feedback in comments or shoot me an email at irrfankhann29@gmail.com


Leave a reply to irfy Cancel reply